2.3 Expressions
Programming languages are much simpler than human languages. Nonetheless, there are some rules of grammar to learn in any language, and that is where we will begin. In this text, we will use the Python programming language. Learning the grammar rules is essential, and the same rules used in the most basic programs are also central to more sophisticated programs.
Programs contain expressions.
You can think of an expression as a recipe that returns a value. For example, this is an expression:
3 * 4
12
Notice that the Notebook displays the value. This the value that the expression returns.
An expression can describe to the computer how to combine pieces of data. In
our example, we have a multiplication expression that consists of a * symbol
between two numerical expressions. Expressions, such as 3 * 4, are
evaluated by the computer. The value (the result of evaluation) of the
last expression in each cell, 12 in this case, is displayed below the cell.
The grammar rules of a programming language are rigid. In Python, the *
symbol cannot appear twice in a row. The computer will not try to interpret an
expression that differs from its prescribed expression structures. Instead, it
will show a SyntaxError error. The Syntax of a language is its set of
grammar rules, and a SyntaxError indicates that an expression structure
doesn’t match any of the rules of the language.
For example, consider this code, and the resulting error:
3 * * 4
  File "<ipython-input-2-012ea60b41dd>", line 1
    3 * * 4
        ^
SyntaxError: invalid syntax
Small changes to an expression can change its meaning entirely. Below, the
space between the *’s has been removed. Because ** appears between two
numerical expressions, the expression is a well-formed exponentiation
expression (the first number raised to the power of the second: 3 times 3
times 3 times 3). The symbols * and ** are called operators, and the
values they combine are called operands.
3 ** 4
81
Common Operators. Data science often involves combining numerical values, and the set of operators in a programming language are designed to so that expressions can be used to express any sort of arithmetic. In Python, the following operators are essential.
| Expression Type | Operator | Example | Value |
|---|---|---|---|
| Addition | + |
2 + 3 |
5 |
| Subtraction | - |
2 - 3 |
-1 |
| Multiplication | * |
2 * 3 |
6 |
| Division | / |
7 / 3 |
2.66667 |
| Remainder | % |
7 % 3 |
1 |
| Exponentiation | ** |
2 ** 0.5 |
1.41421 |
Python expressions obey the same familiar rules of precedence as in algebra: multiplication and division occur before addition and subtraction. Parentheses can be used to group together smaller expressions within a larger expression.
Multiplication has precedence (we do 2 * 3 before adding to 1).
1 + 2 * 3
7
We can use parentheses to group expressions that should be evaluated first.
Here we force 1 + 2 before the multiplication by 3.
(1 + 2) * 3
9
In the expression above, the 1 + 2 is a sub-expression within the whole
expression (1 + 2) * 3. When Python sees this line, it finds the expression
(1 + 2) and evaluates that to get 3. Then it evaluates 3 * 3 to get
9.
As you learn to program, you will learn to think about what Python is doing, and the logical steps it follows. Over time, you will find it easier to predict what it will do, and understand why.
Example
Here, from the Washington Post in the early 1980s, is a graph that attempts to compare the earnings of doctors with the earnings of other professionals over a few decades. Do we really need to see two heads (one with a stethoscope) on each bar? Edward Tufte, Professor at Yale and one of the world’s experts on visualizing quantitative information, coined the term “chartjunk” for such unnecessary embellishments. This graph is also an example of the “low data-to-ink ratio” that Tufte deplores.
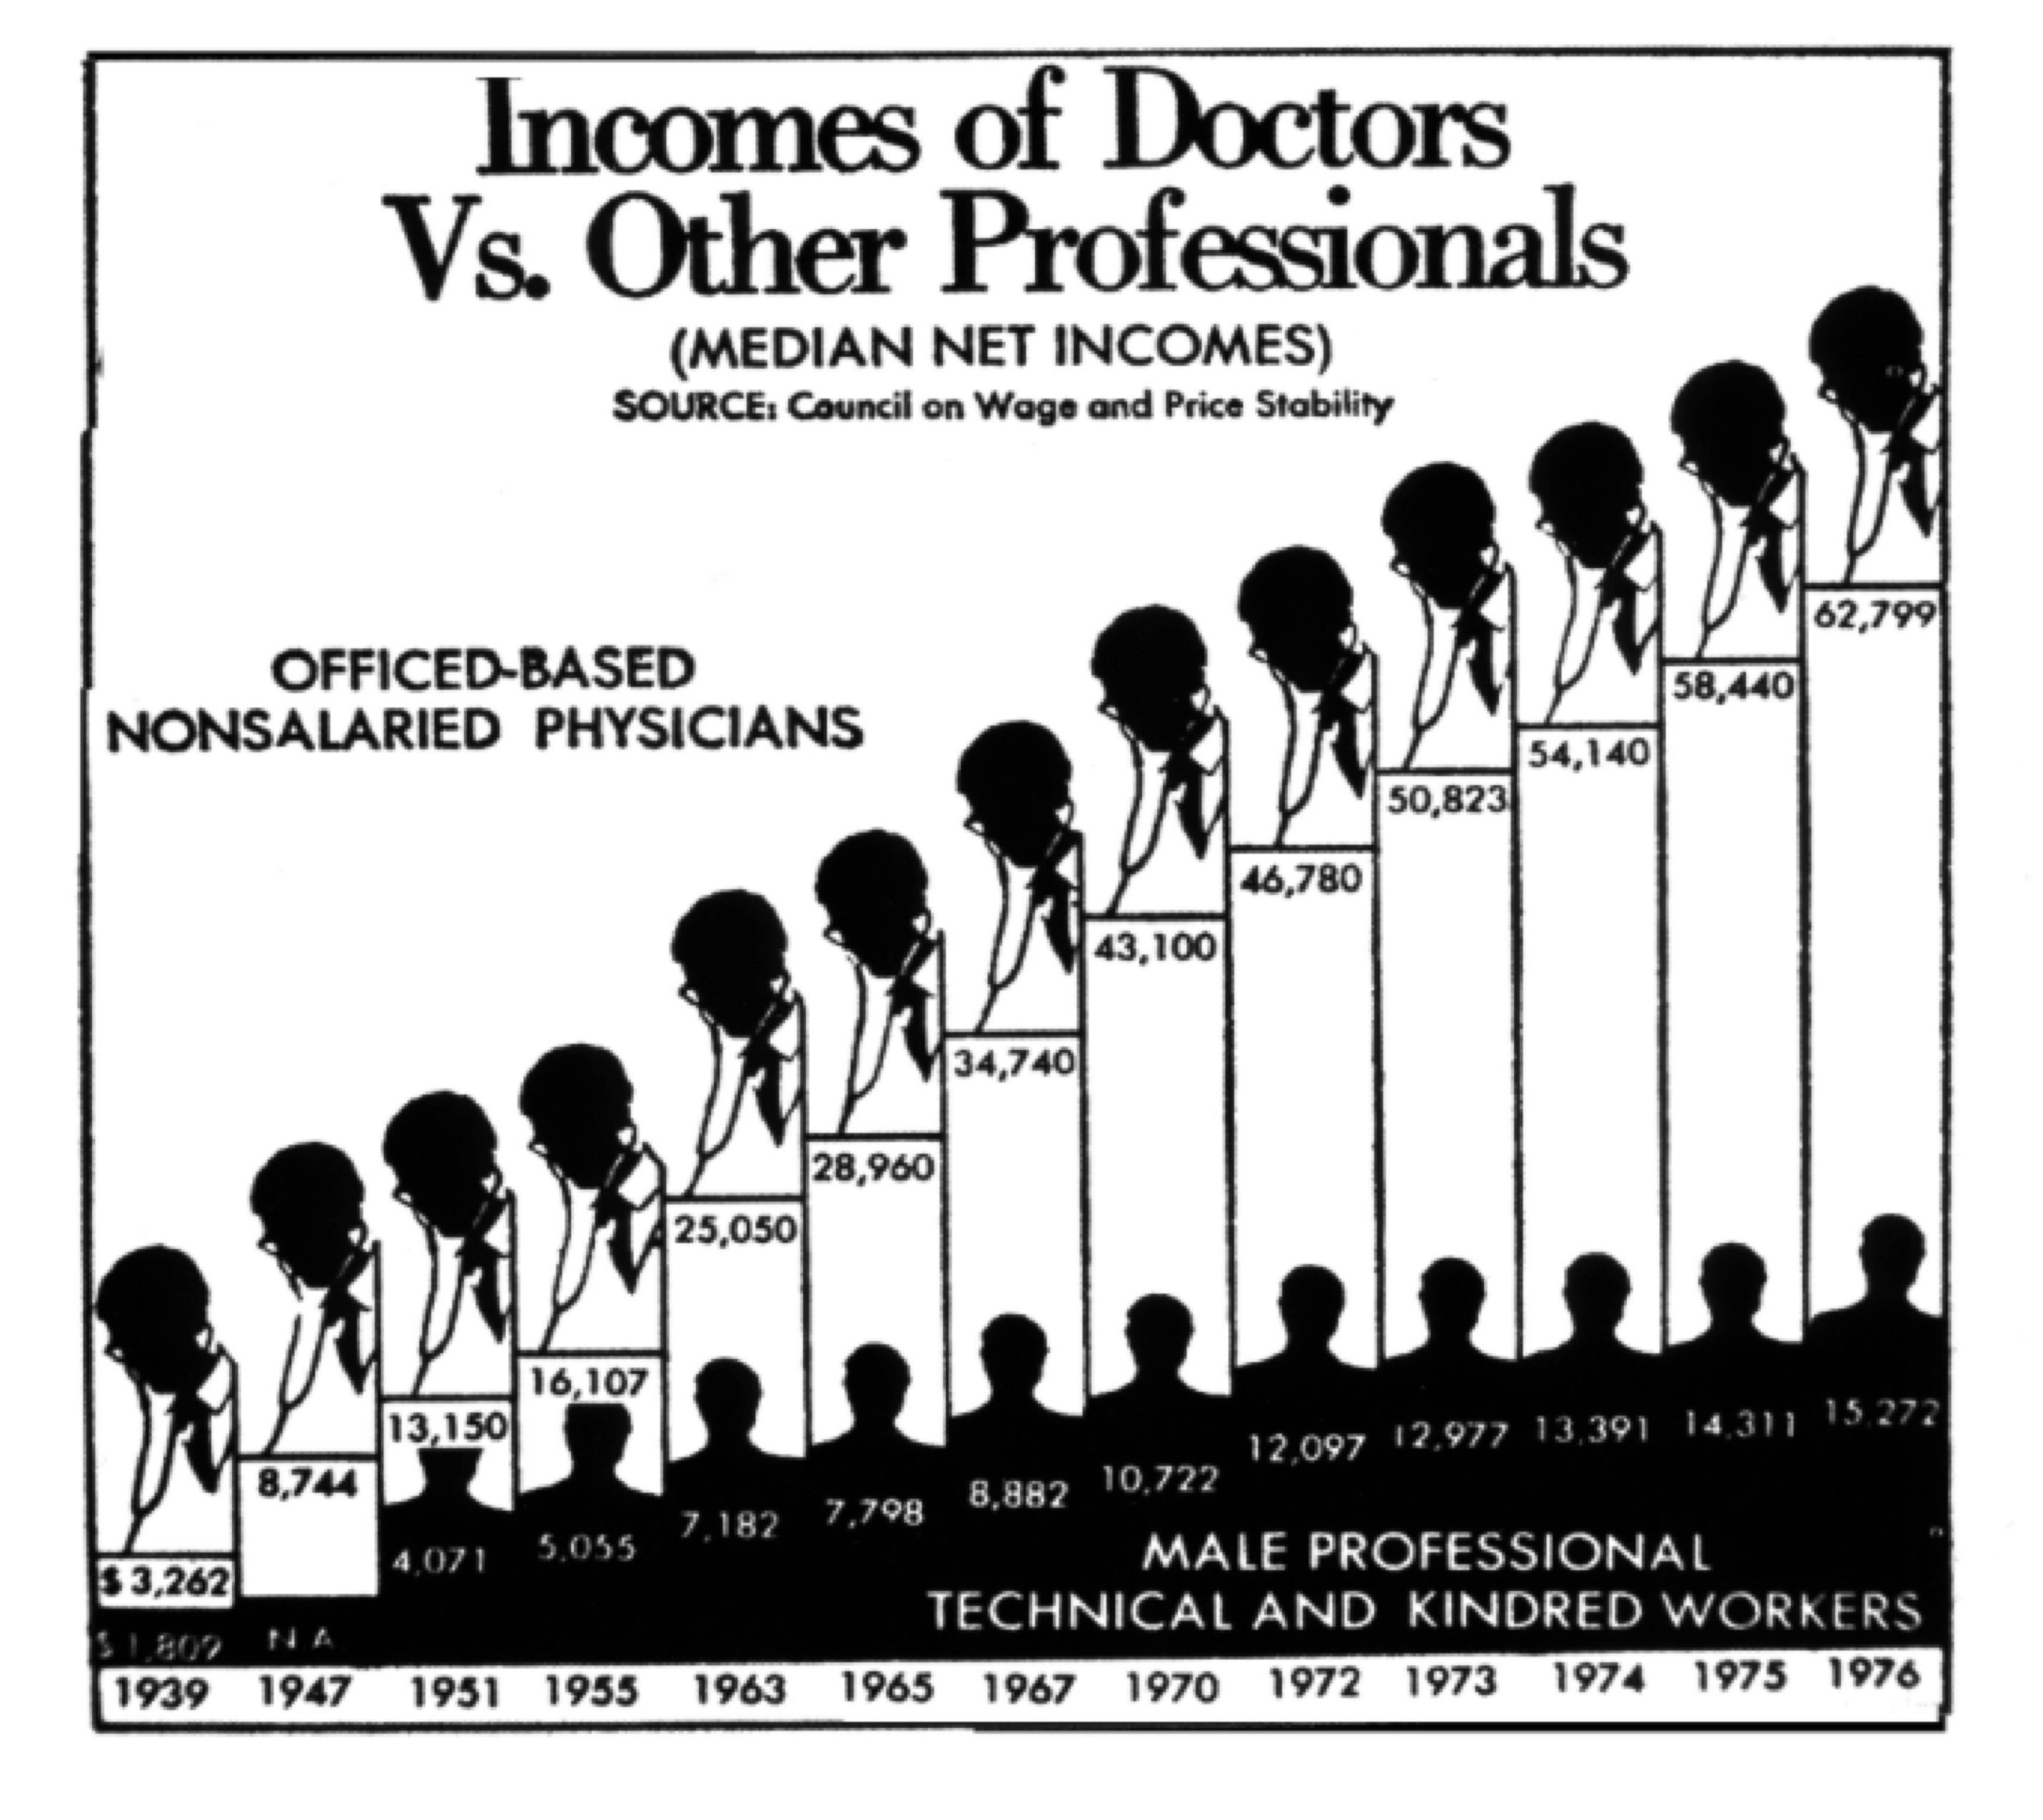
Most importantly, the horizontal axis of the graph is is not drawn to scale. This has a significant effect on the shape of the bar graphs. When drawn to scale and shorn of decoration, the graphs reveal trends that are quite different from the apparently linear growth in the original. The elegant graph below is due to Ross Ihaka, one of the originators of the statistical system R.
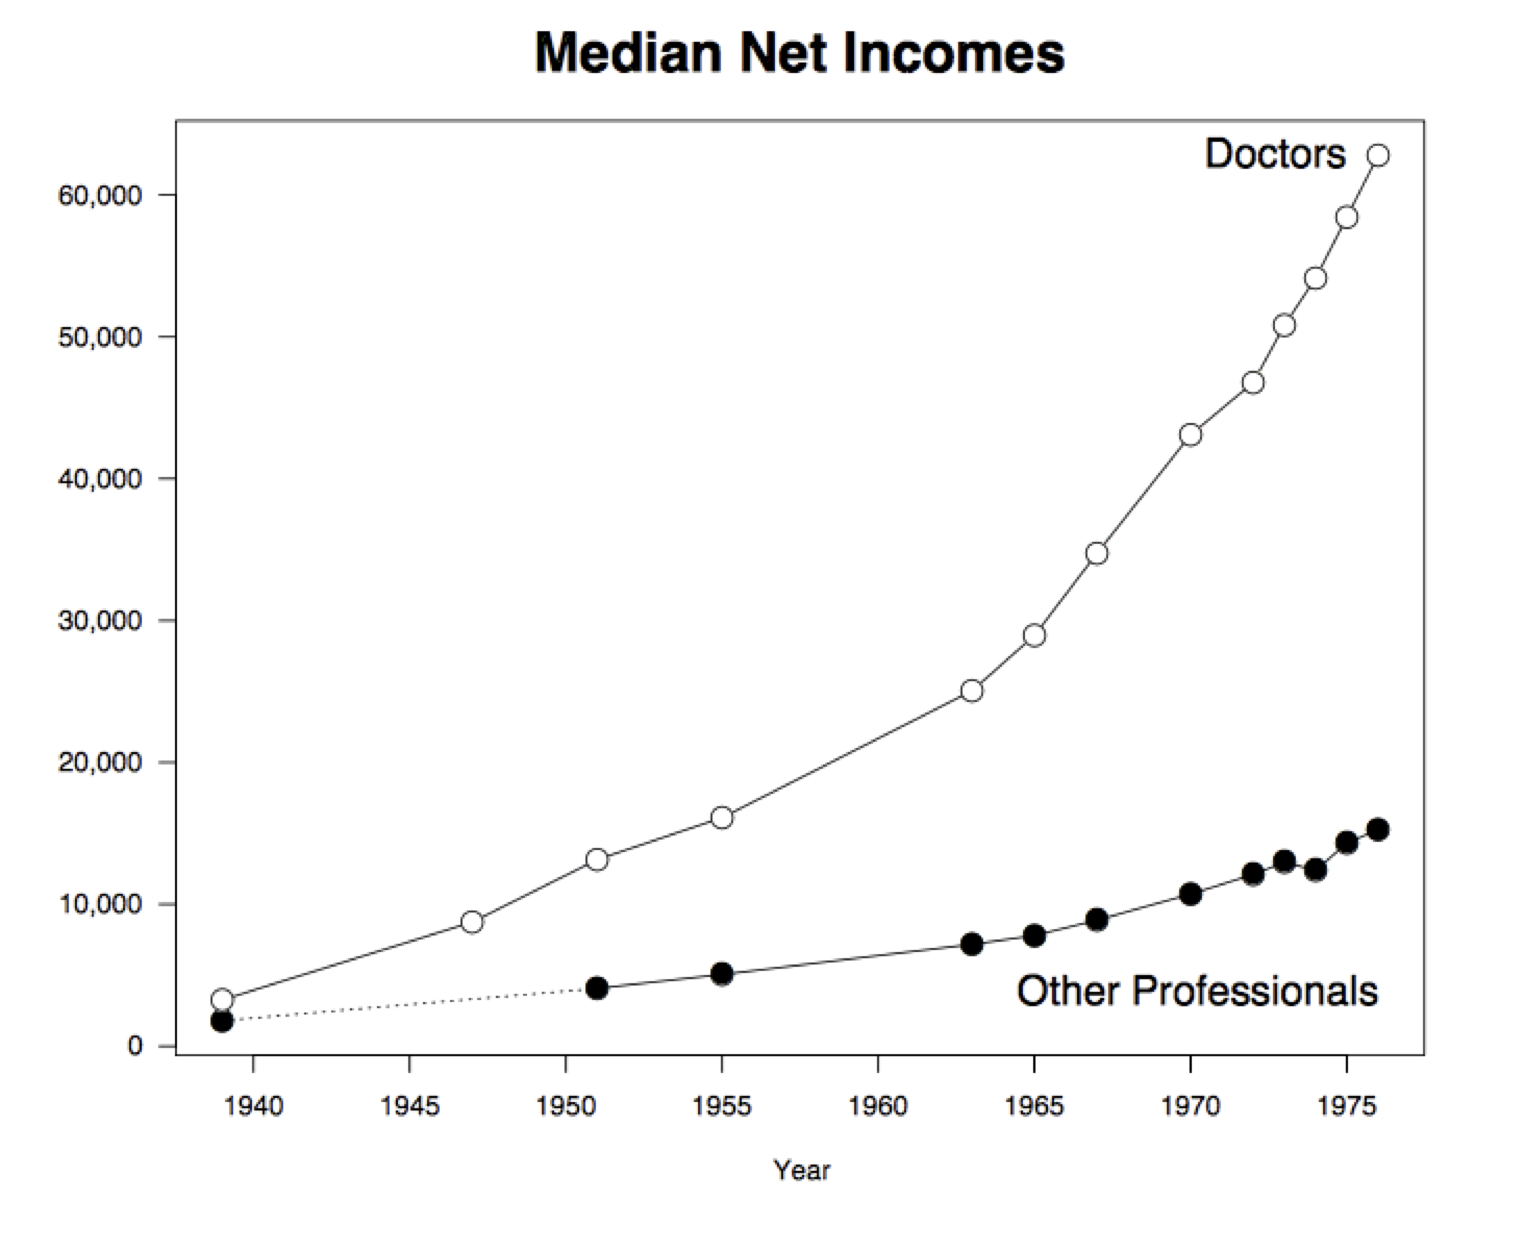
In the period 1939 to 1963, the doctors’ incomes went up from \$3,262 to \$25,050. So during that period the average increase in income per year was about \$900.
(25050 - 3262)/(1963 - 1939)
907.8333333333334
In Ross Ihaka’s graph you can see that in this period, the doctors’ incomes rise roughly linearly at a fairly steady rate. That rate is about \$900, as we have just calculated.
But in the period 1963 to 1976, the rate is more than three times as high:
(62799 - 25050)/(1976 - 1963)
2903.769230769231
That is why the graph rises much more steeply after 1963.
This chapter introduces many types of expressions. Learning to program involves trying out everything you learn in combination, investigating the behavior of the computer. What happens if you divide by zero? What happens if you divide twice in a row? You don’t always need to ask an expert (or the Internet); many of these details can be discovered by trying them out yourself.