1.3.2 Another Kind of Character
This page is largely derived from Another_Kind_Of_Character of the UC
Berkeley course - see the license file on the main website.
In some situations, the relationships between quantities allow us to make predictions. This text will explore how to make accurate predictions based on incomplete information and develop methods for combining multiple sources of uncertain information to make decisions.
As an example of visualizing information derived from multiple sources, let us first use the computer to get some information that would be tedious to acquire by hand. In the context of novels, the word “character” has a second meaning: a printed symbol such as a letter or number or punctuation symbol. Here, we ask the computer to count the number of characters and the number of periods in each chapter of Pride and Prejudice.
# In each chapter, count the number of all characters;
# Also count the number of periods.
chars_periods = pd.DataFrame.from_dict({
        'Number of chars in chapter': [len(s) for s in book_chapters],
        'Number of periods': np.char.count(book_chapters, '.')
    })
Here are the data. Each row of the table corresponds to one chapter of the novel and displays the number of characters as well as the number of periods in the chapter. Not surprisingly, chapters with fewer characters also tend to have fewer periods, in general – the shorter the chapter, the fewer sentences there tend to be, and vice versa. The relation is not entirely predictable, however, as sentences are of varying lengths and can involve other punctuation such as question marks.
chars_periods
| Number of chars in chapter | Number of periods | |
|---|---|---|
| 0 | 4613 | 59 |
| 1 | 4420 | 63 |
| 2 | 9746 | 106 |
| 3 | 6045 | 54 |
| 4 | 5390 | 61 |
| 5 | 13287 | 114 |
| 6 | 11492 | 111 |
| 7 | 11274 | 109 |
| 8 | 9971 | 119 |
| 9 | 12798 | 126 |
| 10 | 9160 | 99 |
| 11 | 4020 | 29 |
| 12 | 9654 | 93 |
| 13 | 6576 | 58 |
| 14 | 9956 | 82 |
| 15 | 19475 | 185 |
| 16 | 7436 | 69 |
| 17 | 29704 | 270 |
| 18 | 10845 | 88 |
| 19 | 9374 | 108 |
| 20 | 11521 | 86 |
| 21 | 10181 | 75 |
| 22 | 9807 | 85 |
| 23 | 11066 | 113 |
| 24 | 8774 | 90 |
| 25 | 13227 | 126 |
| 26 | 7374 | 61 |
| 27 | 8390 | 70 |
| 28 | 14010 | 127 |
| 29 | 7187 | 46 |
| ... | ... | ... |
| 31 | 8652 | 78 |
| 32 | 10602 | 99 |
| 33 | 12251 | 92 |
| 34 | 18487 | 130 |
| 35 | 12033 | 83 |
| 36 | 7958 | 70 |
| 37 | 6080 | 47 |
| 38 | 8962 | 74 |
| 39 | 9400 | 104 |
| 40 | 13260 | 110 |
| 41 | 11172 | 87 |
| 42 | 28068 | 237 |
| 43 | 13622 | 90 |
| 44 | 10296 | 68 |
| 45 | 17642 | 153 |
| 46 | 22976 | 180 |
| 47 | 12995 | 110 |
| 48 | 12730 | 124 |
| 49 | 12922 | 111 |
| 50 | 11463 | 106 |
| 51 | 17676 | 168 |
| 52 | 16463 | 185 |
| 53 | 9104 | 81 |
| 54 | 13287 | 125 |
| 55 | 15712 | 163 |
| 56 | 9672 | 72 |
| 57 | 13976 | 131 |
| 58 | 13952 | 149 |
| 59 | 9020 | 87 |
| 60 | 26470 | 269 |
61 rows × 2 columns
In the plot below, there is a dot for each chapter in the book. The horizontal axis represents the number of periods and the vertical axis represents the number of characters.
plt.figure(figsize=(6, 6))
plt.scatter(chars_periods['Number of periods'],
            chars_periods['Number of chars in chapter'],
            color='darkblue')
<matplotlib.collections.PathCollection at 0x1197202b0>
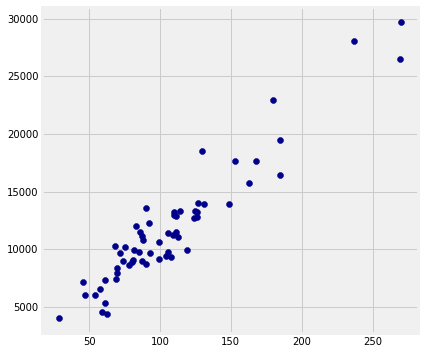
Notice how the blue points are roughly clustered around a straight line.
Now look at all the chapters that contain about 100 periods. The plot shows that those chapters contain about 10,000 characters to about 15,000 characters, roughly. That’s about 90 to 150 characters per period.
Indeed, it appears from looking at the plot that the chapters tend to have somewhere between 100 and 150 characters between periods, as a very rough estimate. Perhaps Jane Austen was announcing something familiar to us now: the original 140-character limit of Twitter.