Noble politics and comparing counts
This page has two aims:
to practice and extend Pandas indexing;
to extend the idea of permutation to data in categories;
We also ask the question - is politics noble?
# Our usual imports
import numpy as np
import pandas as pd
# Safe settings for Pandas.
pd.set_option('mode.chained_assignment', 'raise')

import matplotlib.pyplot as plt
%matplotlib inline
plt.style.use('fivethirtyeight')
Our data is from this book:
Samuel P. Oliner and Pearl M. Oliner (1988) “The Altruistic Personality: Rescuers of Jews in Nazi Europe”. Free Press, New York.
See the dataset page for some more details.
The Oliners wanted to identify distinctive traits of people who rescued Jews in Nazi Europe. In order to do that, they collected structured interviews with 231 people for whom there was strong documentary evidence that they had sheltered Jews, despite considerable risk to themselves. These are the “rescuer” group in the table below. They also found 126 controls with roughly similar background, nationality, age and education. Of these, 53 claimed to have either sheltered Jews, or to have been active in the resistance. These are the “actives” group in the table. This leaves 73 controls who were not active, and the authors termed these “bystanders”.
The table below has data from table 6.8 of their book, where they break down the groups according to the answer they gave to the question “Did you belong to a political party before the war?”.
As usual, if you are running on your own computers, download the file
oliner_tab6_8a_1.csv to the same directory as this notebook.
# Load the table
party_tab = pd.read_csv('oliner_tab6_8a_1.csv')
party_tab
| party_yn | rescuer | active | bystander | |
|---|---|---|---|---|
| 0 | Yes | 44 | 6 | 7 |
| 1 | No | 165 | 44 | 64 |
| 2 | out of | 209 | 50 | 71 |
Setting the index
We have already seen Pandas indexing. We are going to be selecting data out of this table with indexing, and we would like to make the index (row labels) be as informative as possible. The current index, which Pandas created automatically, is sequential numbers, which are not memorable or informative.
party_tab.index
RangeIndex(start=0, stop=3, step=1)
Row labels need not be numbers. They can also be strings. Strings are often more useful in identifying the data in the rows.
We might prefer to use the values in the first column - party_yn as the
labels for the rows.
We can do this with the data frame set_index method. It replaces the current
index (the sequential numbers) with the data from a column.
# Replace the numerical index with the party_yn labels.
party_tab = party_tab.set_index('party_yn')
party_tab
| rescuer | active | bystander | |
|---|---|---|---|
| party_yn | |||
| Yes | 44 | 6 | 7 |
| No | 165 | 44 | 64 |
| out of | 209 | 50 | 71 |
Notice that Pandas took the party_yn column out of the data frame and used it to replace the index.
This makes it easier to use the .loc attribute to select data, using row labels. For example, we can select individual elements like this:
# How many rescuers were there, in total?
party_tab.loc['out of', 'rescuer']
209
The question
Looking at the data in the table, it seems as if the Rescuers had a stronger tendency to belong to a political party than, say, the Bystanders.
To get more specific, we look at the proportion of Rescuers and Bystanders that answered Yes (to being a member of a political party before the war).
The out of row has the total number of people in each column.
# Proportion of Yes for Rescuers.
party_tab.loc['Yes', 'rescuer'] / party_tab.loc['out of', 'rescuer']
0.21052631578947367
# Proportion of Yes for Bystanders.
party_tab.loc['Yes', 'bystander'] / party_tab.loc['out of', 'bystander']
0.09859154929577464
That looks like a substantial difference - but could it have come about by chance?
Let’s put that another way - we see that 44 of 209 Rescuers have “Yes” to belonging to political party. Is 44 a larger number than we would expect by chance?
What do we mean by chance?
We imagine an ideal world where rescuers and bystanders have exactly the same tendency to belong to a political party.
We will take random samples from this world, to see if the random samples look anything like the numbers we see in the actual data. If they do, then we might not be very interested in the differences we see, in the actual data, because the differences could plausibly have come about as a sample from an ideal world where there was no difference in tendency to belong to political parties.
So, how do we take samples from this ideal world?
We will take the same number of fake rescuers as there are real rescuers, and the same number of fake bystanders as there are real bystanders.
We will assume that the same number of people overall are members of a political party:
# Number of people who belonged to a political party.
n_yes = party_tab.loc['Yes', 'rescuer'] + party_tab.loc['Yes', 'bystander']
n_yes
51
This leaves the rest, who were not a member of a political party:
# Number of people who did not belong to a political party.
n_no = party_tab.loc['No', 'rescuer'] + party_tab.loc['No', 'bystander']
n_no
229
This is a total of:
n_yes + n_no
280
We therefore have 280 labels (51 Yes labels and 229 No labels) to assign to our 280 people (209 rescuers and 71 bystanders).
In our ideal world, this assignment to “Yes” and “No” is random. We can shuffle up the labels (“Yes”, “No”), and assign each person (rescuer, bystander) a shuffled (therefore, random) label. We take this fake pairing, and calculate the numbers in each of the four categories, to create a fake table, that is a random version of the actual table. If we do that many times, we can get an idea of how the numbers vary in the fake tables, and therefore, what randomness looks like, in this ideal world, of no association between rescuer / bystander and Yes / No.
Cleaning up the table
We start by selecting the data we need from the original table.
First we use loc indexing to specify that we want:
The rows labeled “No” and “Yes”;
The columns labeled “bystander” and “rescuer”.
bystander_tab = party_tab.loc[['No', 'Yes'], ['bystander', 'rescuer']]
bystander_tab
| bystander | rescuer | |
|---|---|---|
| party_yn | ||
| No | 64 | 165 |
| Yes | 7 | 44 |
Notice the lists ['Yes', 'No'] and ['bystander', 'rescuer'] specifying
the row labels and columns labels that we want.
Notice too that we have swapped the order of the rows (to “No” and “Yes” ) and
the columns (to “bystander” and “rescuer”). This is to better match the
output of pd.crosstab below. You may see what we mean when we get there.
Now we ask you to cast your eye to the bottom-right value of the table, and the value of interest — 44. This is the count for people who were both “rescuer” and said “Yes” to political party. We continue our search to see if this value is larger than we would expect by chance.
Recreating the original data
The bystander_tab table above gives the counts of people in each of the four
categories. We will call this the Counts Table.
To do the shuffling we need, we reconstruct a new people table that has one
row for each person represented in the Counts Table. We could also call this
the Entries Table. Instead of having the counts, it reconstructs the
individual entries that correspond to the counts.
There are 280 people represented in the Counts Table, of which:
64 are “No” for party membership and “bystander” for respondent type.
7 are “Yes” for party and “bystander” for respondent.
165 are “No” for party and “rescuer” for respondent.
44 are “Yes” for party and “rescuer” for respondent.
We can create the Entries Table in bits, first the “No” / “bystander” rows, then the “Yes” / “bystander” rows, and so on.
The first bit should have 64 rows, with label “No” in the party_yn column,
and “bystander” in the respondent column.
To make 64 “No”s, we use np.repeat. Check the function signature with
np.repeat? and Enter in a new cell.
# Make the rows for "No" and "bystander".
bystanders_no = pd.DataFrame()
bystanders_no['party_yn'] = np.repeat(['No'], 64)
bystanders_no['respondent'] = 'bystander'
bystanders_no.head()
| party_yn | respondent | |
|---|---|---|
| 0 | No | bystander |
| 1 | No | bystander |
| 2 | No | bystander |
| 3 | No | bystander |
| 4 | No | bystander |
Next we make the rows for “Yes” and “bystander”:
bystanders_yes = pd.DataFrame()
bystanders_yes['party_yn'] = np.repeat(['Yes'], 7)
bystanders_yes['respondent'] = 'bystander'
bystanders_yes
| party_yn | respondent | |
|---|---|---|
| 0 | Yes | bystander |
| 1 | Yes | bystander |
| 2 | Yes | bystander |
| 3 | Yes | bystander |
| 4 | Yes | bystander |
| 5 | Yes | bystander |
| 6 | Yes | bystander |
We make the rows for “No” / “rescuer” and “Yes” / “rescuer”:
rescuers_no = pd.DataFrame()
rescuers_no['party_yn'] = np.repeat(['No'], 165)
rescuers_no['respondent'] = 'rescuer'
rescuers_yes = pd.DataFrame()
rescuers_yes['party_yn'] = np.repeat(['Yes'], 44)
rescuers_yes['respondent'] = 'rescuer'
rescuers_yes.head()
| party_yn | respondent | |
|---|---|---|
| 0 | Yes | rescuer |
| 1 | Yes | rescuer |
| 2 | Yes | rescuer |
| 3 | Yes | rescuer |
| 4 | Yes | rescuer |
Finally use the pd.concat function to stick all these rows together into one big data frame with 64 + 7 + 165 + 44 = 280 rows.
# Stack the parts into one long data frame.
# ignore_index=True throws away the row labels (index) from the component
# parts, and resets the index to the default sequential numbers from 0 through # 279.
people = pd.concat([bystanders_no, bystanders_yes,
                    rescuers_no, rescuers_yes],
                    ignore_index=True)
people
| party_yn | respondent | |
|---|---|---|
| 0 | No | bystander |
| 1 | No | bystander |
| 2 | No | bystander |
| 3 | No | bystander |
| 4 | No | bystander |
| ... | ... | ... |
| 275 | Yes | rescuer |
| 276 | Yes | rescuer |
| 277 | Yes | rescuer |
| 278 | Yes | rescuer |
| 279 | Yes | rescuer |
280 rows × 2 columns
In fact we could have done this more efficiently by making better use of
np.repeat, like this:
# More efficient way to use np.repeat to make the same data frame.
people2 = pd.DataFrame()
people2['party_yn'] = np.repeat(['No', 'Yes', 'No', 'Yes'],
                                [64, 7, 165, 44])
people2['respondent'] = np.repeat(['bystander', 'rescuer'],
                                  [71, 209])
# The values are the same as the data frame we made above.
print('people and people2 the same?', people.equals(people2))
people2
people and people2 the same? True
| party_yn | respondent | |
|---|---|---|
| 0 | No | bystander |
| 1 | No | bystander |
| 2 | No | bystander |
| 3 | No | bystander |
| 4 | No | bystander |
| ... | ... | ... |
| 275 | Yes | rescuer |
| 276 | Yes | rescuer |
| 277 | Yes | rescuer |
| 278 | Yes | rescuer |
| 279 | Yes | rescuer |
280 rows × 2 columns
We can check the counts in the people data frame by doing some row selection.
For example, to check we really do have 64 rows with the label “No” in
party_yn and “bystander” in respondent, we could do this:
no_rows = people[people['party_yn'] == 'No']
no_bystander_rows = no_rows[no_rows['respondent'] == 'bystander']
len(no_bystander_rows)
64
Luckily, Pandas has a crosstab function that does this counting work for us,
for all four combinations of “Yes”, “No” and “bystander”, “rescuer”.
people_tab = pd.crosstab(people['party_yn'], people['respondent'])
people_tab
| respondent | bystander | rescuer |
|---|---|---|
| party_yn | ||
| No | 64 | 165 |
| Yes | 7 | 44 |
As we hoped, the pd.crosstab on the people data frame regenerates the Counts Table we started with.
We have used pd.crosstab to reconstruct the Counts Table from our Entries
Table.
The null world
The null or ideal world for our question is a world where the pairing of the
party_yn “Yes” / “No” labels and the respondent “bystander” / “rescuer”
labels are random.
We can make a data frame from that world doing a random shuffle of the
party_yn labels in our Entries Table, so the pairing of the party_yn and
respondent labels is random.
First pull out the party_yn values for later use.
party_yn = people['party_yn']
Next, shuffle the party_yn values, and put them back into a fake version of the Entries Table data frame:
shuffled_party = np.random.permutation(party_yn)
fake_data = people.copy()
fake_data['party_yn'] = shuffled_party
fake_data.head(10)
| party_yn | respondent | |
|---|---|---|
| 0 | No | bystander |
| 1 | No | bystander |
| 2 | No | bystander |
| 3 | Yes | bystander |
| 4 | No | bystander |
| 5 | No | bystander |
| 6 | No | bystander |
| 7 | No | bystander |
| 8 | No | bystander |
| 9 | No | bystander |
By the way — we only care about the random pairing between party_yn and
respondent. We shuffled party_yn above, but we could instead have shuffled
respondent, or both; any of these would generate a random pairing.
We now need the counts of people in each category. That is we need counts for:
‘No’ paired with ‘bystander’
‘Yes’ paired with ‘bystander’
‘No’ paired with ‘rescuer’
‘Yes’ paired with ‘rescuer’
For example, remember we are particularly interested in the combination of “Yes” and “rescuer”.
fake_tab = pd.crosstab(fake_data['party_yn'], fake_data['respondent'])
fake_tab
| respondent | bystander | rescuer |
|---|---|---|
| party_yn | ||
| No | 57 | 172 |
| Yes | 14 | 37 |
We saw in the original data that the rescuers seemed to have a greater tendency to belong to a political party. Let us restrict our attention to the count of “Yes” and “rescuer”.
That count, in our original Counts Table, was:
actual_y_resc = bystander_tab.loc['Yes', 'rescuer']
actual_y_resc
44
The equivalent count in our new fake Counts Table is:
fake_y_resc = fake_tab.loc['Yes', 'rescuer']
fake_y_resc
37
We need more random samples to see if the fake value is often as large as the real value. If so, then the ideal world, where the association between “Yes” / “No, and “bystander” / “rescuer” is random, is a reasonable explanation of what we see in the real world, and we might not want to investigate these data much further.
Unfortunately, pd.crosstab is horribly slow, so we need to drop our usual
number of iterations to 1000 to keep the run-time down.
counts = np.zeros(1000)
for i in np.arange(1000):
    # Make a fake Entries Table by shuffling one set of labels.
    shuffled_party = np.random.permutation(party_yn)
    fake_data = people.copy()
    fake_data['party_yn'] = shuffled_party
    # Get the Counts Table from the fake Entries Table.
    fake_tab = pd.crosstab(fake_data['party_yn'], fake_data['respondent'])
    # Store the count of interest.
    counts[i] = fake_tab.loc['Yes', 'rescuer']
# Show the first 10 counts.
counts[:10]
array([41., 39., 41., 36., 38., 41., 41., 36., 40., 41.])
Here is our sampling distribution from sampling in the ideal world:
plt.hist(counts);
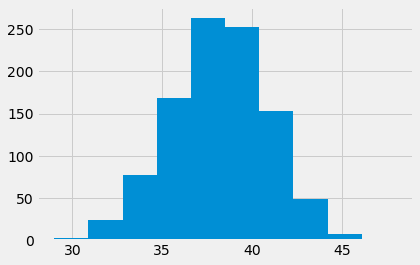
How unusual is the actual value, in this ideal world?
# Proportion of times we see ideal world sample >= actual value.
p_lte = np.count_nonzero(counts >= actual_y_resc) / len(counts)
p_lte
0.03
A question for reflection
Now look at this. Here I do the same test, but I am looking at both of these counts, for each trial:
“Yes”, “rescuer”.
“No”, “bystander”.
# Yes, rescuer
counts_y_resc = np.zeros(1000)
# No, rescuer
counts_n_by = np.zeros(1000)
for i in np.arange(1000):
    # Make a fake Entries Table by shuffling one set of labels.
    shuffled_party = np.random.permutation(party_yn)
    fake_data = people.copy()
    fake_data['party_yn'] = shuffled_party
    # Get the Counts Table from the fake Entries Table.
    fake_tab = pd.crosstab(fake_data['party_yn'], fake_data['respondent'])
    # Store the "Yes" / "rescuer" count.
    counts_y_resc[i] = fake_tab.loc['Yes', 'rescuer']
    # Also store the "No" / "bystander" count.
    counts_n_by[i] = fake_tab.loc['No', 'bystander']
Here are the values of the “Yes” / “rescuer” counts for the first 10 trials.
# First ten Yes rescuer counts
counts_y_resc[:10]
array([37., 37., 38., 44., 36., 39., 38., 40., 41., 43.])
These are the corresponding “No” / “bystander” counts:
# First ten No bystander counts
counts_n_by[:10]
array([57., 57., 58., 64., 56., 59., 58., 60., 61., 63.])
You may notice that they go up and down in exactly the same way. When the “Yes” / “rescuer” count goes up or down by 1, so does the “No” / “bystander” count - and the same is true for any change in the values; +1, +2, +3 …, -1, -2, -3 …
Therefore, the difference between the counts on each trial is always the same. In our case, the difference is -20:
# The difference between the counts for each trial is always the same.
count_diff = counts_y_resc - counts_n_by
print('First 10 differences', count_diff[:10])
print("Differences all the same?")
np.all(count_diff == count_diff[0])
First 10 differences [-20. -20. -20. -20. -20. -20. -20. -20. -20. -20.]
Differences all the same?
True
If we know the “Yes” / “rescuer” value, we can get the corresponding “No” / “bystander” value by subtracting -20 (in our particular case).
This means that if we calculate the corresponding p values for the “Yes” / “rescuer” or “No” / “bystander” counts, they are exactly the same.
# Proportion of times we see ideal world sample >= actual value.
p_lte_y_resc = np.count_nonzero(counts_y_resc >= actual_y_resc) / len(counts)
p_lte_y_resc
0.034
The test for “No”, “bystander” follows.
# Proportion of times we see ideal world sample >= actual value.
actual_n_by = bystander_tab.loc['No', 'bystander']
p_lte_n_by = np.count_nonzero(counts_n_by >= actual_n_by) / len(counts)
p_lte_n_by
0.034
See if you can work out why these counts go up and down in exactly the same way, on each trial. Why does this mean that the p values must be the same?
After a little reflection, have a look at the 2 by 2 tables page.