Generate figures for quick reference tables#
This final section contains the code for figures used in the line properties table in the Matplotlib page.
import numpy as np
import matplotlib.pyplot as plt
# Machinery to store outputs for later use.
# This is for rendering in the Jupyter Book version of these pages.
from myst_nb import glue
Line property figures#
This example demonstrates using alpha for transparency:
size = 256, 16
dpi = 72.0
figsize = size[0] / float(dpi), size[1] / float(dpi)
fig = plt.figure(figsize=figsize, dpi=dpi)
fig.patch.set_alpha(0)
plt.axes((0, 0.1, 1, 0.8), frameon=False)

for i in range(1, 11):
    plt.axvline(i, linewidth=1, color="blue", alpha=0.25 + 0.75 * i / 10.0)

plt.xlim(0, 11)
plt.xticks([])
plt.yticks([])

# Store figure for use in reference table.
glue("plot_alpha", fig, display=False)

This example demonstrates aliased versus anti-aliased text.
First, aliased text (antialiased=False):
size = 128, 16
dpi = 72.0
figsize = size[0] / float(dpi), size[1] / float(dpi)
fig = plt.figure(figsize=figsize, dpi=dpi)
fig.patch.set_alpha(0)

plt.axes((0, 0, 1, 1), frameon=False)

plt.rcParams["text.antialiased"] = False
plt.text(0.5, 0.5, "Aliased", ha="center", va="center")

plt.xlim(0, 1)
plt.ylim(0, 1)
plt.xticks([])
plt.yticks([])

# Reset rcParams back to defaults
plt.rcdefaults()

# Store figure for use in reference table.
glue("plot_aliased", fig, display=False)

Next, antialiased=True.
fig = plt.figure(figsize=figsize, dpi=dpi)
fig.patch.set_alpha(0)
plt.axes((0, 0, 1, 1), frameon=False)

plt.rcParams["text.antialiased"] = True
plt.text(0.5, 0.5, "Anti-aliased", ha="center", va="center")

plt.xlim(0, 1)
plt.ylim(0, 1)
plt.xticks([])
plt.yticks([])

# Reset rcParams back to defaults
plt.rcdefaults()

# Store figure for use in reference table.
glue("plot_antialiased", fig, display=False)

An example demoing the various colors taken by Matplotlib’s plot.
size = 256, 16
dpi = 72.0
figsize = size[0] / float(dpi), size[1] / float(dpi)
fig = plt.figure(figsize=figsize, dpi=dpi)
fig.patch.set_alpha(0)
plt.axes((0, 0.1, 1, 0.8), frameon=False)

for i in range(1, 11):
    plt.plot([i, i], [0, 1], lw=1.5)

plt.xlim(0, 11)
plt.xticks([])
plt.yticks([]);

# Store figure for use in reference table.
glue("plot_color", fig, display=False)

Plot various linewidths with Matplotlib.
size = 256, 16
dpi = 72.0
figsize = size[0] / float(dpi), size[1] / float(dpi)
fig = plt.figure(figsize=figsize, dpi=dpi)
fig.patch.set_alpha(0)
plt.axes((0, 0.1, 1, 0.8), frameon=False)

for i in range(1, 11):
    plt.plot([i, i], [0, 1], color="b", lw=i / 2.0)

plt.xlim(0, 11)
plt.ylim(0, 1)
plt.xticks([])
plt.yticks([]);

# Store figure for use in reference table.
glue("plot_linewidth", fig, display=False)

An example demoing the solid cap style in Matplotlib.
size = 256, 16
dpi = 72.0
figsize = size[0] / float(dpi), size[1] / float(dpi)
fig = plt.figure(figsize=figsize, dpi=dpi)
fig.patch.set_alpha(0)
plt.axes((0, 0, 1, 1), frameon=False)

plt.plot(np.arange(4), np.ones(4), color="blue", linewidth=8, solid_capstyle="butt")

plt.plot(
    5 + np.arange(4), np.ones(4), color="blue", linewidth=8, solid_capstyle="round"
)

plt.plot(
    10 + np.arange(4),
    np.ones(4),
    color="blue",
    linewidth=8,
    solid_capstyle="projecting",
)

plt.xlim(0, 14)
plt.xticks([])
plt.yticks([]);

# Store figure for use in reference table.
glue("plot_solid_capstyle", fig, display=False)

An example showing the different solid joint styles in Matplotlib.
size = 256, 16
dpi = 72.0
figsize = size[0] / float(dpi), size[1] / float(dpi)
fig = plt.figure(figsize=figsize, dpi=dpi)
fig.patch.set_alpha(0)
plt.axes((0, 0, 1, 1), frameon=False)

plt.plot(np.arange(3), [0, 1, 0], color="blue", linewidth=8, solid_joinstyle="miter")
plt.plot(
    4 + np.arange(3), [0, 1, 0], color="blue", linewidth=8, solid_joinstyle="bevel"
)
plt.plot(
    8 + np.arange(3), [0, 1, 0], color="blue", linewidth=8, solid_joinstyle="round"
)

plt.xlim(0, 12)
plt.ylim(-1, 2)
plt.xticks([])
plt.yticks([])

# Store figure for use in reference table.
glue("plot_solid_joinstyle", fig, display=False)

An example demoing the dash capstyle.
size = 256, 16
dpi = 72.0
figsize = size[0] / float(dpi), size[1] / float(dpi)
fig = plt.figure(figsize=figsize, dpi=dpi)
fig.patch.set_alpha(0)
plt.axes((0, 0, 1, 1), frameon=False)

plt.plot(
    np.arange(4),
    np.ones(4),
    color="blue",
    dashes=[15, 15],
    linewidth=8,
    dash_capstyle="butt",
)

plt.plot(
    5 + np.arange(4),
    np.ones(4),
    color="blue",
    dashes=[15, 15],
    linewidth=8,
    dash_capstyle="round",
)

plt.plot(
    10 + np.arange(4),
    np.ones(4),
    color="blue",
    dashes=[15, 15],
    linewidth=8,
    dash_capstyle="projecting",
)

plt.xlim(0, 14)
plt.xticks([])
plt.yticks([])

# Store figure for use in reference table.
glue("plot_dash_capstyle", fig, display=False)
Example demoing the dash join style.
size = 256, 16
dpi = 72.0
figsize = size[0] / float(dpi), size[1] / float(dpi)
fig = plt.figure(figsize=figsize, dpi=dpi)
fig.patch.set_alpha(0)
plt.axes((0, 0, 1, 1), frameon=False)

plt.plot(
    np.arange(3),
    [0, 1, 0],
    color="blue",
    dashes=[12, 5],
    linewidth=8,
    dash_joinstyle="miter",
)
plt.plot(
    4 + np.arange(3),
    [0, 1, 0],
    color="blue",
    dashes=[12, 5],
    linewidth=8,
    dash_joinstyle="bevel",
)
plt.plot(
    8 + np.arange(3),
    [0, 1, 0],
    color="blue",
    dashes=[12, 5],
    linewidth=8,
    dash_joinstyle="round",
)

plt.xlim(0, 12)
plt.ylim(-1, 2)
plt.xticks([])
plt.yticks([]);

# Store figure for use in reference table.
glue("plot_dash_joinstyle", fig, display=False)

Demo the marker edge widths of Matplotlib’s markers.
size = 256, 16
dpi = 72.0
figsize = size[0] / float(dpi), size[1] / float(dpi)
fig = plt.figure(figsize=figsize, dpi=dpi)
fig.patch.set_alpha(0)
plt.axes((0, 0, 1, 1), frameon=False)

for i in range(1, 11):
    plt.plot(
        [
            i,
        ],
        [
            1,
        ],
        "s",
        markersize=5,
        markeredgewidth=1 + i / 10.0,
        markeredgecolor="k",
        markerfacecolor="w",
    )
plt.xlim(0, 11)
plt.xticks([])
plt.yticks([])

# Store figure for use in reference table.
glue("plot_mew", fig, display=False)

Demo the marker edge color of Matplotlib’s markers.
size = 256, 16
dpi = 72.0
figsize = size[0] / float(dpi), size[1] / float(dpi)
fig = plt.figure(figsize=figsize, dpi=dpi)
fig.patch.set_alpha(0)
plt.axes((0, 0, 1, 1), frameon=False)

rng = np.random.default_rng()

for i in range(1, 11):
    r, g, b = np.random.uniform(0, 1, 3)
    plt.plot(
        [
            i,
        ],
        [
            1,
        ],
        "s",
        markersize=5,
        markerfacecolor="w",
        markeredgewidth=1.5,
        markeredgecolor=(r, g, b, 1),
    )

plt.xlim(0, 11)
plt.xticks([])
plt.yticks([])

# Store figure for use in reference table.
glue("plot_mec", fig, display=False)

Demo the marker face color of Matplotlib’s markers.
size = 256, 16
dpi = 72.0
figsize = size[0] / float(dpi), size[1] / float(dpi)
fig = plt.figure(figsize=figsize, dpi=dpi)
fig.patch.set_alpha(0)
plt.axes((0, 0, 1, 1), frameon=False)

rng = np.random.default_rng()

for i in range(1, 11):
    r, g, b = np.random.uniform(0, 1, 3)
    plt.plot(
        [
            i,
        ],
        [
            1,
        ],
        "s",
        markersize=8,
        markerfacecolor=(r, g, b, 1),
        markeredgewidth=0.1,
        markeredgecolor=(0, 0, 0, 0.5),
    )
plt.xlim(0, 11)
plt.xticks([])
plt.yticks([])

# Store figure for use in reference table.
glue("plot_mfc", fig, display=False)

Demo the marker size control in Matplotlib.
size = 256, 16
dpi = 72.0
figsize = size[0] / float(dpi), size[1] / float(dpi)
fig = plt.figure(figsize=figsize, dpi=dpi)
fig.patch.set_alpha(0)
plt.axes((0, 0, 1, 1), frameon=False)

for i in range(1, 11):
    plt.plot(
        [
            i,
        ],
        [
            1,
        ],
        "s",
        markersize=i,
        markerfacecolor="w",
        markeredgewidth=0.5,
        markeredgecolor="k",
    )

plt.xlim(0, 11)
plt.xticks([])
plt.yticks([])

# Store figure for use in reference table.
glue("plot_ms", fig, display=False)

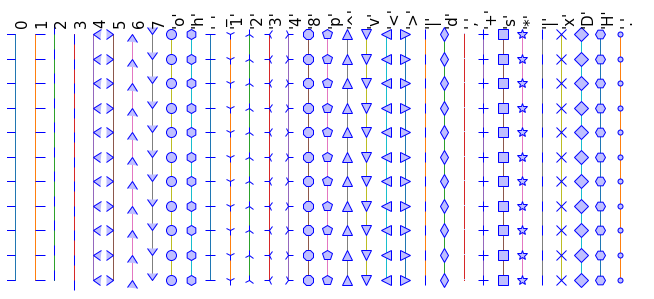
Line styles figure#
def linestyle(ls, i):
    X = i * 0.5 * np.ones(11)
    Y = np.arange(11)
    plt.plot(
        X,
        Y,
        ls,
        color=(0.0, 0.0, 1, 1),
        lw=3,
        ms=8,
        mfc=(0.75, 0.75, 1, 1),
        mec=(0, 0, 1, 1),
    )
    plt.text(0.5 * i, 10.25, ls, rotation=90, fontsize=15, va="bottom")

linestyles = [
    "-",
    "--",
    ":",
    "-.",
    ".",
    ",",
    "o",
    "^",
    "v",
    "<",
    ">",
    "s",
    "+",
    "x",
    "d",
    "1",
    "2",
    "3",
    "4",
    "h",
    "p",
    "|",
    "_",
    "D",
    "H",
]
n_lines = len(linestyles)

size = 20 * n_lines, 300
dpi = 72.0
figsize = size[0] / float(dpi), size[1] / float(dpi)
fig = plt.figure(figsize=figsize, dpi=dpi)
plt.axes((0, 0.01, 1, 0.9), frameon=False)

for i, ls in enumerate(linestyles):
    linestyle(ls, i)

plt.xlim(-0.2, 0.2 + 0.5 * n_lines)
plt.xticks([])
plt.yticks([])

# Store figure for use in reference sections.
glue("line_styles_fig", fig, display=False)
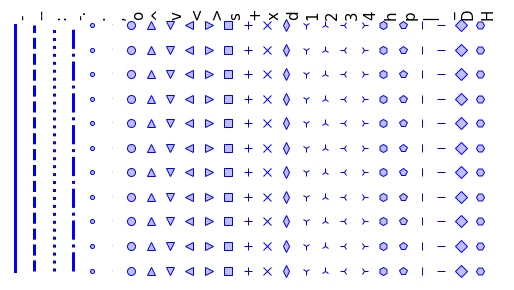
Marker style figure#
def marker(m, i):
    X = i * 0.5 * np.ones(11)
    Y = np.arange(11)

    plt.plot(X, Y, lw=1, marker=m, ms=10, mfc=(0.75, 0.75, 1, 1), mec=(0, 0, 1, 1))
    plt.text(0.5 * i, 10.25, repr(m), rotation=90, fontsize=15, va="bottom")

markers = [
    0,
    1,
    2,
    3,
    4,
    5,
    6,
    7,
    "o",
    "h",
    "_",
    "1",
    "2",
    "3",
    "4",
    "8",
    "p",
    "^",
    "v",
    "<",
    ">",
    "|",
    "d",
    ",",
    "+",
    "s",
    "*",
    "|",
    "x",
    "D",
    "H",
    ".",
]

n_markers = len(markers)

size = 20 * n_markers, 300
dpi = 72.0
figsize = size[0] / float(dpi), size[1] / float(dpi)
fig = plt.figure(figsize=figsize, dpi=dpi)
plt.axes((0, 0.01, 1, 0.9), frameon=False)

for i, m in enumerate(markers):
    marker(m, i)

plt.xlim(-0.2, 0.2 + 0.5 * n_markers)
plt.xticks([])
plt.yticks([])

# Store figure for use in reference sections.
glue("marker_styles_fig", fig, display=False)
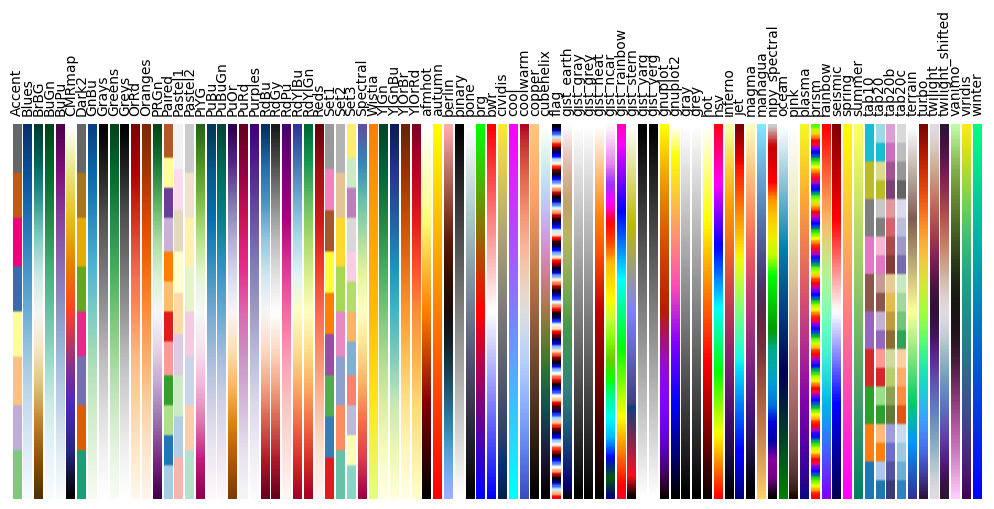
Colormap figure#
plt.rc("text", usetex=False)
a = np.outer(np.arange(0, 1, 0.01), np.ones(10))

fig = plt.figure(figsize=(10, 5))
plt.subplots_adjust(top=0.8, bottom=0.05, left=0.01, right=0.99)
maps = [m for m in plt.colormaps if not m.endswith("_r")]
maps.sort()
l = len(maps) + 1

for i, m in enumerate(maps):
    plt.subplot(1, l, i + 1)
    plt.axis("off")
    plt.imshow(a, aspect="auto", cmap=plt.get_cmap(m), origin="lower")
    plt.title(m, rotation=90, fontsize=10, va="bottom")

# Restore Matplotlib defaults.
plt.rcdefaults()

# Store figure for use in reference sections.
glue("colormap_fig", fig, display=False)