\(\newcommand{L}[1]{\| #1 \|}\newcommand{VL}[1]{\L{ \vec{#1} }}\newcommand{R}[1]{\operatorname{Re}\,(#1)}\newcommand{I}[1]{\operatorname{Im}\, (#1)}\)
Sampling distribution for linear relationship
Test the null hypothesis that the observed linear relationship between variables is compatible with the distribution of relationships when order of the second variable is randomized.
See: Schooling and fertility.
>>> #: The random module
>>> import random
>>> def list_product(first_list, second_list):
...     product = 0
...     for i in range(len(first_list)):
...         value = first_list[i] * second_list[i]
...         product = product + value
...     return product
>>> def linear_permute(measures_1, measures_2):
...     measures_1 = list(measures_1)
...     new_measures_2 = list(measures_2)
...     n_samples = 10000
...     observed = list_product(measures_1, measures_2)
...     sample_products = []
...     for i in range(n_samples):
...         random.shuffle(new_measures_2)
...         product = list_product(measures_1, new_measures_2)
...         sample_products.append(product)
...     return observed, sample_products
In action on the school, fertility data.
>>> import pandas as pd
>>> school_fertility = pd.read_csv('school_fertility.csv')
>>> school = list(school_fertility['school'])
>>> fertility = list(school_fertility['fertility'])
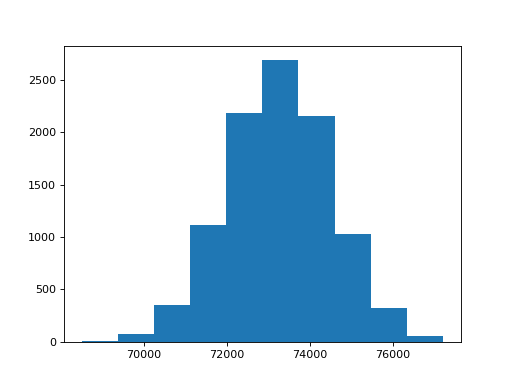
>>> observed, distribution = linear_permute(school, fertility)
>>> observed
63210.978138184139
Hint
If running in the IPython console, consider running %matplotlib to enable
interactive plots. If running in the Jupyter Notebook, use %matplotlib
inline.
>>> import matplotlib.pyplot as plt
>>> plt.hist(distribution)
(...)
