\(\newcommand{L}[1]{\| #1 \|}\newcommand{VL}[1]{\L{ \vec{#1} }}\newcommand{R}[1]{\operatorname{Re}\,(#1)}\newcommand{I}[1]{\operatorname{Im}\, (#1)}\)
Attitudes to animal research
Introduction to the data
Here we are going to try to analyze the data from this survey:
https://www.ipsos.com/ipsos-mori/en-uk/attitudes-animal-research-2016
You can download the raw data from here:
https://discover.ukdataservice.ac.uk/catalogue?sn=8059
To be helpful, I have unpacked the tab-delimited data file for you, and also converted the data dictionary document to a PDF:
Download the data file to the directory containing this Notebook.
>>> #: Load pandas
>>> import pandas as pd
>>> #: Read file into data frame
>>> df = pd.read_table('ols_animal_research_survey_data_2016.tab')
Display the data frame:
>>> #: Display the data frame
>>> df
        ID  Q1  Q2a  Q2b  Q3a  Q3b  Q3c  Q3d  Q3e  Q3f   ...    Empstat  qual  \
0    10150   2    1    2    5    1    1    1    5    3   ...          3     1 ...
1    10170   1    1    1    1    1    1    5    2    1   ...          3     3 ...
2    10190   3    2    2    3    1    5    1    5    2   ...          2     2 ...
3    10210   3    2    3    3    2    3    3    4    2   ...          3     2 ...
4    10230   3    3    3    2    2    2    3    4    2   ...          3     2 ...
5    10250   3    2    3    3    2    2    2    4    2   ...          1     1 ...
...

[987 rows x 248 columns]
Show the list of the all the column names:
>>> #- Show the column names
>>> df.columns
Index(['ID', 'Q1', 'Q2a', 'Q2b', 'Q3a', 'Q3b', 'Q3c', 'Q3d', 'Q3e', 'Q3f',
       ...
       'Empstat', 'qual', 'marstat', 'access', 'Income', 'Broadsheet',
       'MidMarket', 'Tabloid', 'NoPpr', 'weight'],
      dtype='object', length=248)
Have a look at the data dictionary. Find the name of the column containing the variable with label “Sources of balanced information about use of: Universities”. Keep a note of that.
Now find the name of the column with label “Sources of balanced information about use of: Animal protection organisations”. Keep a note of that too.
Finally, find the column for “Sources of balanced information about use of: Politicians / MPs”. Note as well.
Use indexing to select make a new data frame containing only these three
columns from the original data frame. It will look something like questions
=df[ followed by the names of the columns you just found. Have a look at
Analyzing Brexit for inspiration.
>>> #- Select only the two columns we found above.
>>> #- Something like
>>> #- questions = df[ something here ]
>>> questions = df[['Q7_1', 'Q7_2', 'Q7_6']]
Check that your new questions data frame has the column names you
expected.
>>> #- Show the column names for the new "questions" data frame
>>> questions.columns
Index(['Q7_1', 'Q7_2', 'Q7_6'], dtype='object')
Rename the columns to "trust_uni", "trust_protectors",
"trust_politicians". See Analyzing Brexit for inspiration.
>>> #- Rename the columns of the new data frame to:
>>> #- "trust_uni", "trust_protectors", "trust_politicians"
>>> questions.columns = ['trust_uni', 'trust_protectors', 'trust_politicians']
>>> questions.columns
Index(['trust_uni', 'trust_protectors', 'trust_politicians'], dtype='object')
Hint
If running in the IPython console, consider running %matplotlib to enable
interactive plots. If running in the Jupyter Notebook, use %matplotlib
inline.
Import the plotting library, using the same conventions as in Analyzing Brexit:
>>> #- Import the plotting library
>>> import matplotlib.pyplot as plt
Plot a histogram of the values for the question about trusting universities.
>>> #- A histogram of the values for the trust universities question
>>> plt.hist(questions['trust_uni']);
(...)
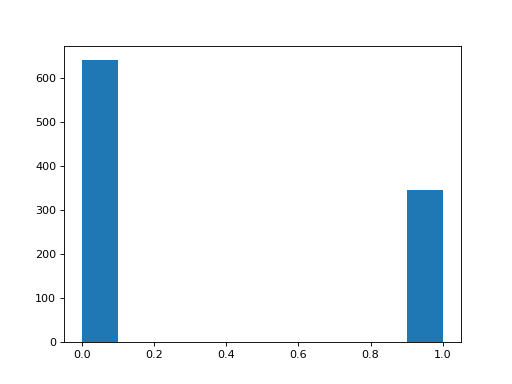
Check in the data dictionary above - what do 0 and 1 mean?
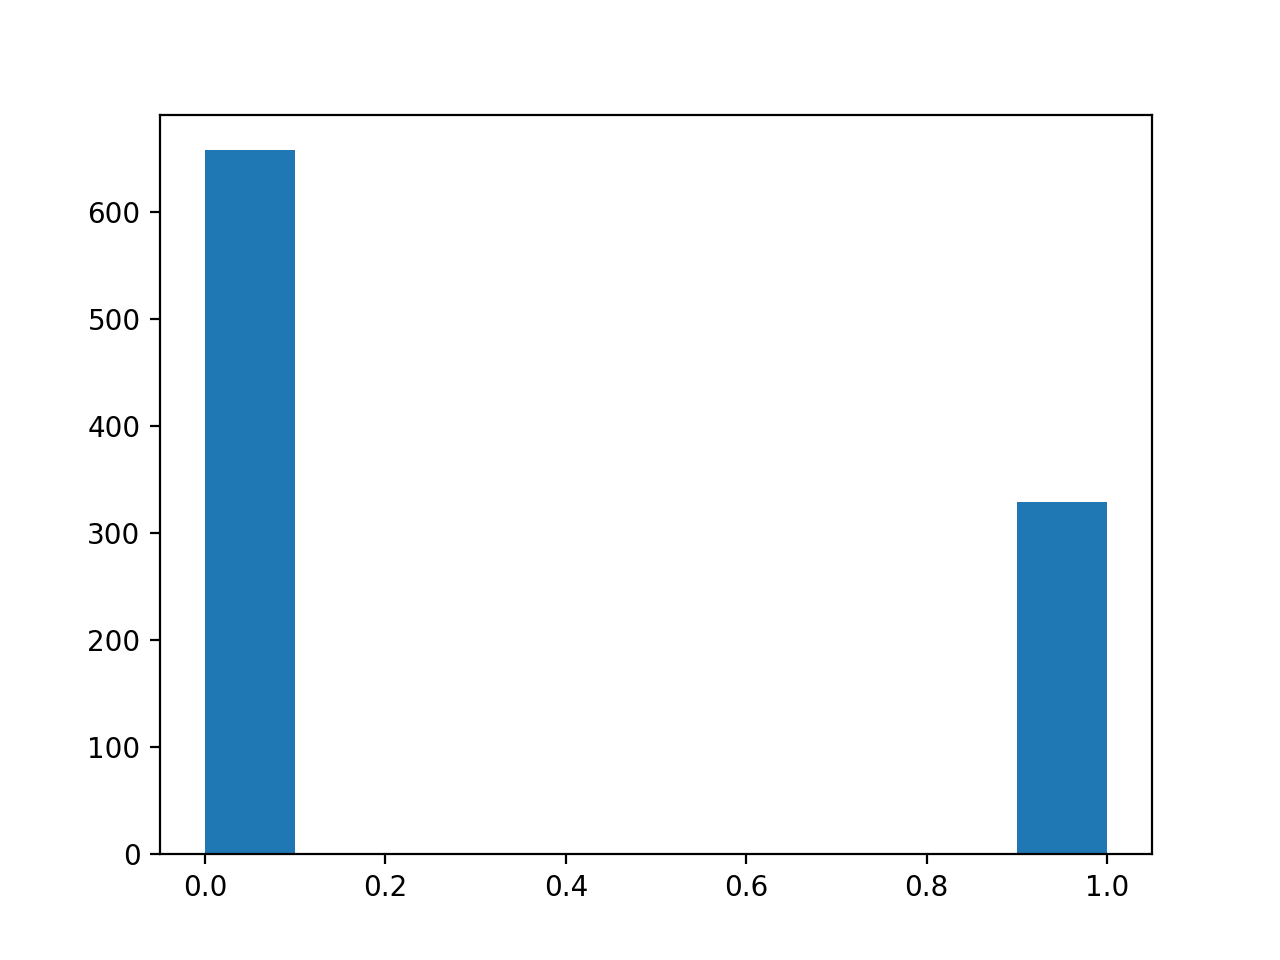
Plot a histogram of the values for the question about trusting Animal Protection Organizations:
>>> #- A histogram of the values for the trust APOs question
>>> plt.hist(questions['trust_protectors']);
(...)

Do you think there is a substantial difference between these histograms? How would you check?
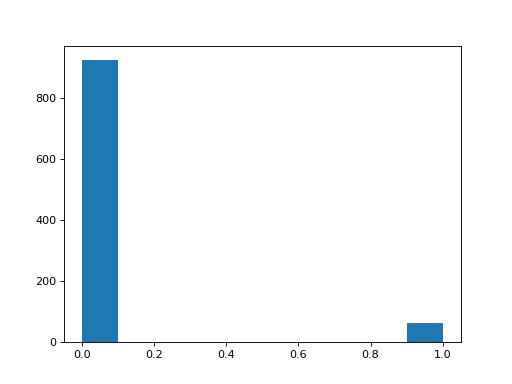
Plot the histogram for the trust in politicians. Is there a difference between this question and the other two? How would you check?
>>> #- A histogram of the values for the trust APOs question
>>> plt.hist(questions['trust_politicians']);
(...)

Save the reduced data frame in case we want to use it later:
>>> questions.to_csv('animal_questions.csv', index=False)
A permutation test
Here we try and answer one of the questions above - is there a difference
between the yes / no answers for the trust_uni answers and the
trust_proectors answers. Do the respondents trust universities more than
Animal Protection Organizations (APOs)?
To start, let’s make lists for the data we are going to study:
>>> trust_uni = list(questions['trust_uni'])
>>> trust_protectors = list(questions['trust_protectors'])
They came from the same data frame, so we are pretty sure they have the same lengths:
>>> len(trust_uni)
987
>>> len(trust_protectors)
987
First - is there any differences in the answers? We can see in the data
dictionary that 0 means “No” or “Do not trust” and 1 means “Yes” or “Do
trust”. So we can see how many “Yes” votes there were with sum:
>>> sum(trust_uni)
346
>>> sum(trust_protectors)
329
>>> observed_difference = sum(trust_uni) - sum(trust_protectors)
>>> observed_difference
17
Of course we could also use mean, where the result will be the average
answer, towards 0 if more people don’t trust, towards 1 if more people do
trust:
>>> def mean(my_list):
...     return sum(my_list) / len(my_list)
>>> mean(trust_uni)
0.35055724417426543
>>> mean(trust_protectors)
0.33333333333333331
>>> mean(trust_uni) - mean(trust_protectors)
0.017223910840932111
So, there is a difference. But did this difference come about through some random factor in the way people were answering the questions? Or can we exclude that as unlikely?
What is our null hypothesis.
There is some randomness to the answers to both questions trust_uni and
trust_protectors. This randomness is a reasonable explanation for the
observed differences in the sum or mean of the answers to these questions.
If the null hypothesis is true, then we can consider the answers to the two questions to be, effectively, an answer to the same question, maybe something like “do you trust special interest groups?”.
But - careful - does our null hypothesis make us believe that we can take the answer from one person and allocate it to another? No - our null hypothesis allows different people to have different views on “do you trust special interest groups”, but not to have different views on universities versus Animal Protection Organizations?
So, how can we let people have their different views on the general question, while pretending (for now) that they have the same view of universities and APOs?
Our null hypothesis allows us to swap the answers for the two questions, within one person. Here is what it looks like if we randomly swap the answers to the questions:
>>> import random
>>> def sum_with_swap(answers_1, answers_2):
...     # Make new lists for the answers where some are swapped
...     new_answers_1 = []
...     new_answers_2 = []
...     for i in range(len(answers_1)):
...         if random.random() >= 0.5:
...             # Don't swap
...             answer_1 = answers_1[i]
...             answer_2 = answers_2[i]
...         else:
...             # Swap
...             answer_2 = answers_1[i]
...             answer_1 = answers_2[i]
...         new_answers_1.append(answer_1)
...         new_answers_2.append(answer_2)
...     return sum(new_answers_1) - sum(new_answers_2)
Try a single trial with swaps:
>>> sum_with_swap(trust_uni, trust_protectors)
-7
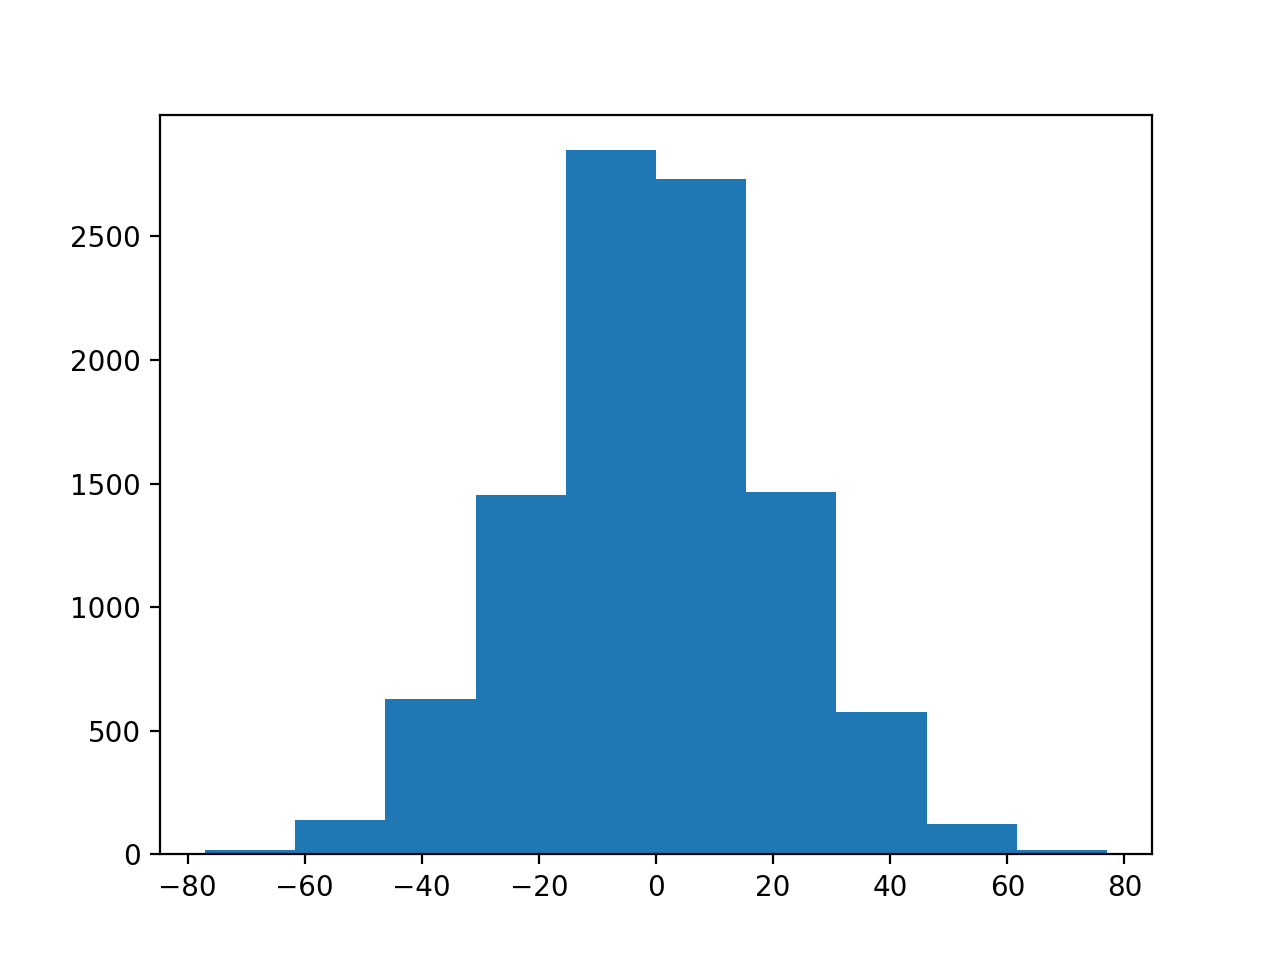
Now we can do one trial, we build up our sampling distribution:
>>> n_repeats = 10000
>>> sampled_sums = []
>>> for i in range(n_repeats):
...     one_trial = sum_with_swap(trust_uni, trust_protectors)
...     sampled_sums.append(one_trial)
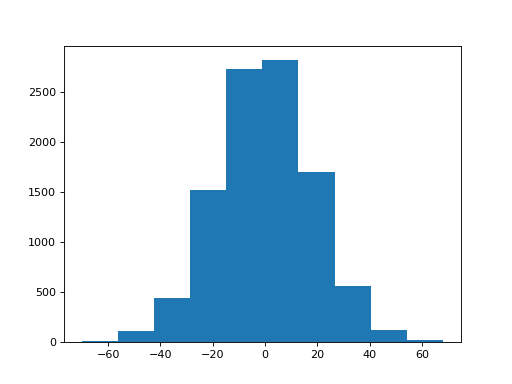
We plot the distribution:
Hint
If running in the IPython console, consider running %matplotlib to enable
interactive plots. If running in the Jupyter Notebook, use %matplotlib
inline.
>>> import matplotlib.pyplot as plt
>>> plt.hist(sampled_sums)
(...)

Remember the observed difference:
>>> observed_difference
17
What do you think - is the difference in the answers to trust_uni and
trust_protectors compatible with randomness in the answers to the
questions, or is there some real difference here?
Let’s do the same test for trust in politicians:
>>> trust_politicians = list(questions['trust_politicians'])
>>> politicians_observed = sum(trust_uni) - sum(trust_politicians)
>>> politicians_observed
284
Ouch.
Now for our pair swap test:
>>> sampled_sums = []
>>> for i in range(n_repeats):
...     one_trial = sum_with_swap(trust_uni, trust_politicians)
...     sampled_sums.append(one_trial)
>>> plt.hist(sampled_sums)
(...)
What do you think about the difference in trust between universities and politicians?