Plotting lines in matplotlib#
import matplotlib.pyplot as plt
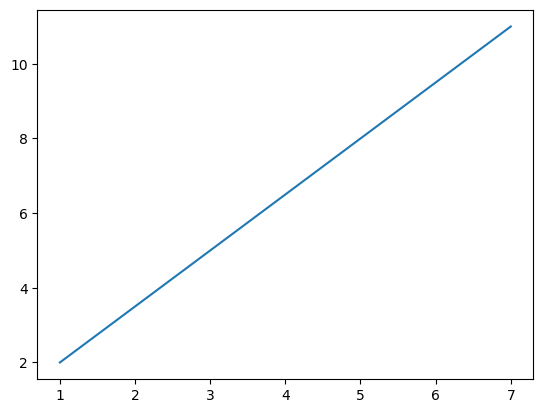
To plot a line in matplotlib, use plot with the X coordinates as the first
argument and the matching Y coordinates as the second argument:
# A line from (1, 2) to (7, 11)
plt.plot([1, 7], [2, 11])
[<matplotlib.lines.Line2D at 0x7ff410e30ca0>]
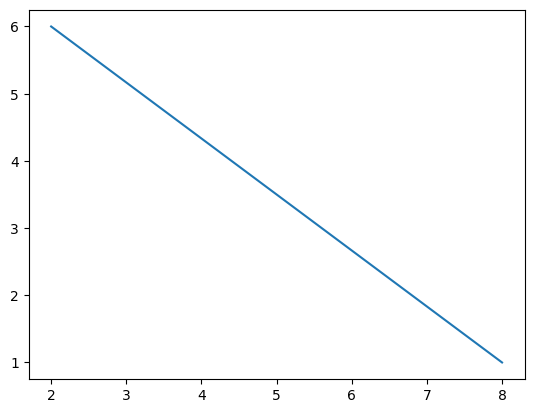
# Another line from (2, 6) to (8, 1)
plt.plot([2, 8], [6, 1])
[<matplotlib.lines.Line2D at 0x7ff410d36440>]